(New Tips & Hints (28
You mention several ways to plot data in MEW, which is the best?
ANSWER:
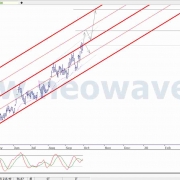
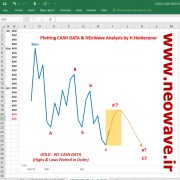
The discussion in Chapter 2 (pages 9-12) of Mastering Elliott Wave on plotting data is often misunderstood. When the book was written, access to market data was not what it is today – personal computers were in their infancy. With high, low, close cash data now easy to obtain on a daily (and even an intra-day) basis, the best way to track wave structure is to plot the high and low of each session (whether hourly, daily, weekly, etc.) in the order they occurred in real-time. That is the method I use for all NEoWave CHART services.


دیدگاه خود را ثبت کنید
تمایل دارید در گفتگوها شرکت کنید؟در گفتگو ها شرکت کنید.